If you’ve ever had a conversation with me, the odds are pretty darn good that we got around to the topic of water. As a health care
practitioner, I’m water’s biggest advocate. I’ve seen it alleviate all manner of discomforts from headaches to backaches to constipation. And as a child of nature, I’m an even bigger water lover. I grew up on the shores of a beautiful lake in northern Minnesota, and from that time onward I have been drawn like a bee to the flowers to all the forms of water on the planet.
So when I recently ran across some very, very startling statistics regarding the production, use, and elimination of bottled water, I knew I had to share it with you here. I hope you have already learned these things elsewhere, and I wish surely wish I had learned them sooner, but I’m a believer in right timing, so here we go now.
In 2006, U.S. bottled water sales exceeded 8 billion gallons (31 billion liters) of water.
In 2004, on average, every single American consumed 90.5 liters of bottled water (1). Worldwide, the per-person averages ranged from 183.6 liters for Italians, 168.5 liters for Mexicans, 141.6 liters for the French, to 24.2 liters for the global average. The total global consumption of bottled water in 2004 was 154 billion liters up from 98 billion liters consumed in 1999 (2). In the United States, this amounted to nearly $11 billion spent on bottled water. (3)
What are the manufacturing implications of those kinds of numbers? The Pacific Institute calculates that the U.S. uses about 17 million barrels of oil per year to make those bottles. And since the manufacture of every ton of PET (polyethylene terephthalate) used to make water bottles produces about 3 tons of carbon dioxide, the manufacture of bottled water is estimated to have produced 2.5 million tons of carbon dioxide in 2006. Plus, once the bottle is manufactured, it must be shipped to its destination. Pete Gleick of the Pacific Institute is quoted as saying the average energy cost of making the plastic, filling the bottle, transporting it to market and then dealing with the bottle waste would be “like filling up a quarter of every bottle with oil.” (4) For example, for every bottle of Fiji brand water imported to the United States, 250g of carbon dioxide is released into the atmosphere (93 g for the bottle’s manufacture in China, 4 g for transporting the empty bottle to Fiji, 153 G for shipping the full bottle to the U.S.) In addition to the oil used to make water bottles, it also takes water. It takes from 3 to 6.74 liters of water to make a 1 liter water bottle container (5).
After all the bo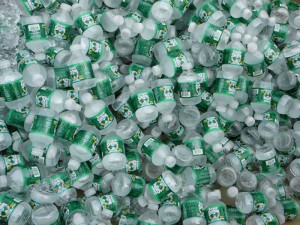 ttles are produced and used, then what? It is currently estimated that only 10-20% of the global production of bottles is recycled. The remaining 80-90% winds up in landfill or the ocean.
Far out in the Pacific Ocean between California and Hawaii, in the area of the sea known as the Doldrums, there are large islands of debris. One island of trash is twice the size of the state of Texas. The Algalita Marine Research Foundation has been able to sample and photograph these islands of trash which are actually circular ocean currents sucking in millions of tons of trash. In 1999, their sampling found that on average, this area of the ocean held six pounds of plastic for every pound of plankton (the tiny organisms that form the base of the ocean’s food chain). In the fall of 2007, their samples found the plastic to plankton ratio ranging from 40-to-1 up to 500-to-1. Check out their website at www.algalita.org.
Most plastic does not biodegrade. It does photo-degrade over time, breaking down into ever-smaller pieces. Captain Charles Moore of the ship Alguita is quoted as saying, “what you’re looking at is a future in which Hawaii’s beaches are covered with plastic and plastic sand will become the norm.” More concerning than that is the fact that animals, birds, fish don’t know not to eat plastic. Their stomachs become clogged and full of plastic that doesn’t allow for the ingestion or digestion of actual food. (6)
One last point for consternation. Though tap water in the U.S. is regulated by stringent guidelines under the Environmental Protection Agency (EPA), bottled water is regulated by the Food and Drug Administration’s significantly less stringent guidelines. They have established “Standards of Identity” for bottled waters sold in the U.S. such as artesian, mineral, purified, spring, sterile or sparkling waters. If you happen to know what these designations mean, you have some chance of buying the kind of water you think you are buying. However, since the FDA does not require details of the water source be added to labels, deciding which brand to buy is a tricky process at best. But let’s save the topic of water quality in general for another day.
These sobering statistics on plastic water bottles have made me realize that even though consuming adequate amounts of water on a daily basis is a requirement for health, we must all also take responsibility for the manner in which we purchase, transport, and finally eliminate any plastic that is involved in our personal water consumption.
I think it’s time to invest as soon are you are able in the following items:
• Stainless steel water bottles; they start at $10 for a small size and go up from there in larger models; buy #304 food-grade stainless steel that can be washed in a dishwasher or in a vinegar water bath for disinfecting. Most health food stores and sporting good stores stock these now. Or check out www.newwaveenviro.com. These make really nice Christmas presents, in my opinion.
• Home water purification system; they start very economically as simple charcoal chlorine filtration filters that can be added to a sink or shower spigot and go up from there depending on the quality of water you are seeking. Click here to read about one company’s water filtration system that I recommend.
(1) Rodwan, John (2005), “Bottled Water 2004: U.S. and International Statistics and developments, Bottled Water Reporter, International Bottled Water Association, April/May 2005.
(2) Gleick, P.H. 2004. “Bottled Water.” In P.H. Gleick (editor), The World’s Water 2004-2005: The Biennial Report on Freshwater Resources. Island Press, Washington DC.
(3) Beverage Marketing Corporation 2005 Market Report findings.
(4) Pacific Institute: Bottled Water and Energy: A Fact Sheet; www.pacinst.org/topics/water_and_sustainability/bottled_water/bottled_water_and_energy.html
(5) Estimate by Pablo Paster quoted on Treehugger, www.treehugger.com/files/2007/02/pablo_calculate.php
(6) in Honolulu Weekly, 12/5/07, “Sea of Plastic,” by Alan McNarie